
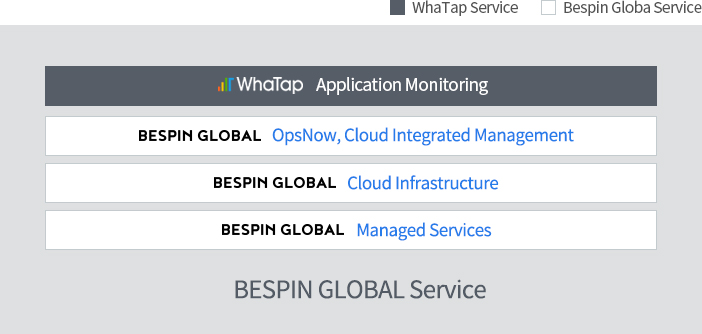
Monitoring application performance in the Cloud.
Bespin Global provides thorough application monitoring environment through its powerful server monitoring solution, WhaTap.
WhaTap Features

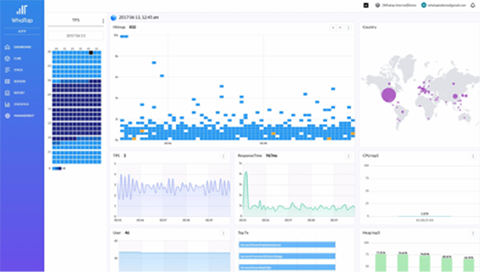
Performance Monitoring
Monitors server performance indicators such as CPU, memory, disk, and traffic

Notification Function
If the server is unresponsive or each performance metric reaches a threshold, it sends an SMS, mobile push, or email notification.

Log, Event Management
Sends an alert when a specific string or event ID is detected in log or event.

Process Monitoring
With a simple check, you can monitor the status information of a given process.

Database Monitoring
You can monitor key performance indicators of a database in minutes. (Supports – MSSQL, Oracle, MySQL, MariaDB)

Multiple Platforms Support
Supports Windows, Linux operating systems and traditional servers, as well as other various platforms such as AWS, GCE and Azure.

Export Function
Monitoring metrics may be converted to various formats (image, document, spreadsheet).

Snapshot Function
Source of the problem can be easily found by providing a snapshot of each indicator at the time of the alert.
Node.js Application Monitoring enables detailed profiling of application transactions
If you have been checking only the resource usage of the Nod.js application, you can now monitor the transaction details as well.
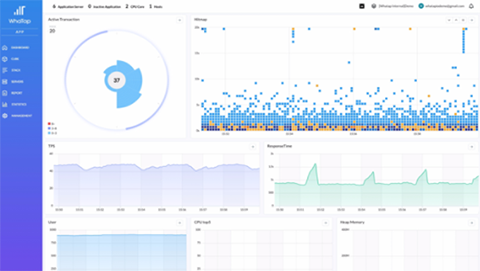
JAVA Application Monitoring lets you check even the code level of transactions
You can also monitor areas that were not previously available with Active Stack technology of WhaTap.
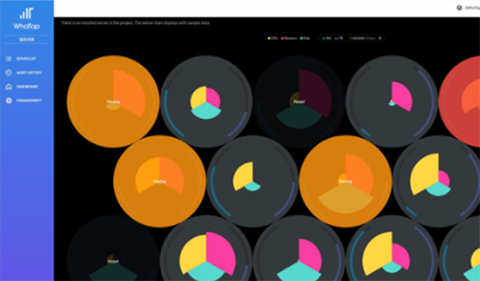
Infrastructure Monitoring shows servers in various environments at a glance
Not only physical servers, but also AWS, Azure, GCE, Aliyun, and other cloud servers can now be monitored in one area at the same time.

Using SaaS-based digital operations monitoring and analysis solutions of CA Digital Experience Insights, Bespin Global offers integrated monitoring and analysis services, which provide a comprehensive view of user experience, business transactions, and digital infrastructure.
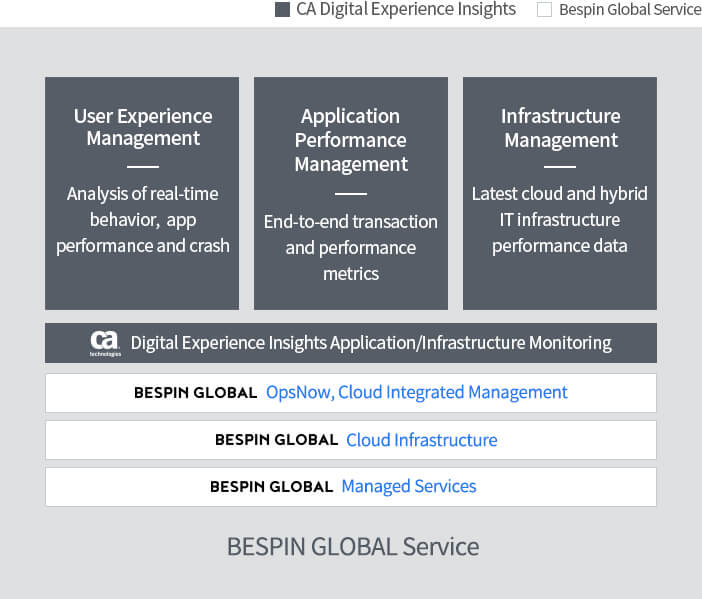
CA Digital Experience Insights Features
App Experience Analytics
Based on a flexible open SaaS analytic foundation, which uniquely combines user behavior with operational performance, it provides an intuitive report, which helps you understand your entire digital environment. This insight can help you optimize the users’ path, helping you retain and acquire new customers, increase sales, shorten troubleshooting time, increase development productivity, and accelerate innovation.
APM (Application Performance Management)
APM supports in-depth analysis from click to code with up-to-date analytics, so DevOps teams joined by multiple departments can gain insights to quickly resolve application issues and identify opportunities for improvement. It also reduces complexity through automated application discovery and baseline setup, dynamic team dashboards, and derived workflows to ensure that all digital interactions deliver the best value to customers.
Infrastructure Management
Supports a single analytically focused solution that efficiently and proactively manages the latest cloud and hybrid IT infrastructures. Organizations can leverage infrastructure management capabilities to improve average end-user experience by reducing average repair time, reducing manual monitoring, and shortening time for new deployment.
CA Digital Experience Insights Benefits

Standardize data and analyze correlations to identify actual problems in the context of user’s own roles and functions, diagnose problems, and quickly diagnose conditions that affect user environment

Apply optimal mathematics and intelligence to identify patterns, trends, and anomalies to predict when the problems will occur

Improved efficiency through better design, better code, and improved resource utilization, and prescribe an improvement plan based on insights that have a positive impact on customer experience

Do you want to see the status of your mobile applications and user behavior analysis at a glance?
Bespin Global accelerates the growth of your apps by analyzing mobile applications running in the cloud.
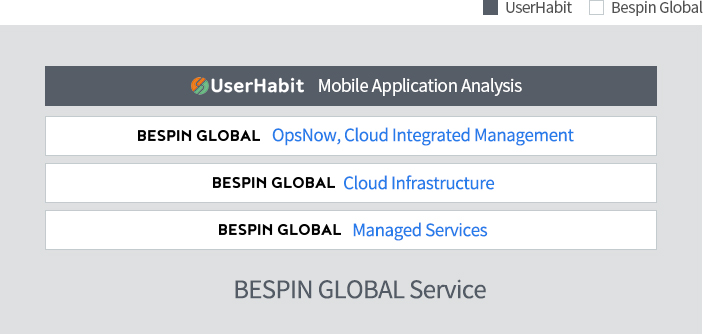
UserHabit Features
UserHabit for Quick and Easy Analysis

Simple Installation Process
By minimizing code insertion for installation, and inserting only one line of code without defining the event, you can start the analysis effortlessly.

Light Operation
Unlike other solutions that use video recording, it is operated with less than 1KB of data thus has less burden on app performance.

Comprehensive UX Data Collection
By classifying the type of action it even recognizes the unresponsive actions, and collects all the actions of users within the app, providing comprehensive UX data.

Easy and Intuitive Analysis Reports
It provides visual information such as heatmap, usage flow chart, and replay along with actual screen, so anyone can easily analyze it intuitively.

Heatmap & User Touch Analysis
You can easily see the user’s touch action information on screen in the form of a heatmap.

Key Metrics for UX Analysis
You can see the key metrics that can help you understand user behavior within the app.

User-defined In-depth Filter
Specialized user filters are used to help you quickly find a specific customer group.

Analysis of Major Usage Flow
Specialized user filters are used to help you quickly find a specific customer group.

Interval Analysis to Target Screen
You can see the user’s usage pattern from a specific screen to the target screen of the app for a detailed analysis of the section.

Detailed Analysis of Individual Path
It provides an analysis of how often the path is used between screens and how they move.

Replay Video
You can reproduce the process of how a specific user uses the app and observe it in detail in the form of a video.

Crash Analysis
It is easy to reproduce crashes and provides a log of the corresponding crashes to enable quick troubleshooting.