
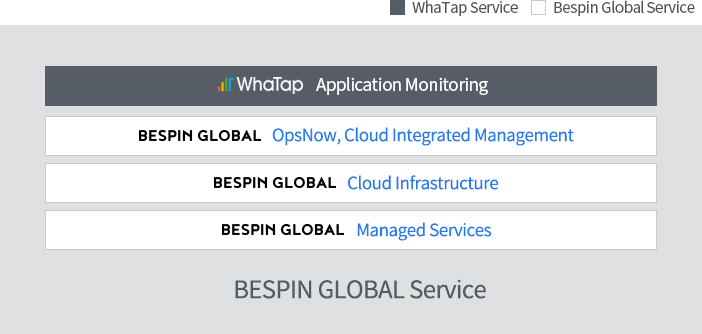
Monitoring application performance in the Cloud. Bespin Global provides thorough application monitoring environment through its powerful server monitoring solution, WhaTap.
WhaTap Features

Performance Monitoring
Monitors server performance indicators such as CPU, memory, disk, and traffic

Notification Function
If the server is unresponsive or each performance metric reaches a threshold, it sends an SMS, mobile push, or email notification.

Log, Event Management
Sends an alert when a specific string or event ID is detected in log or event.

Process Monitoring
With a simple check, you can monitor the status information of a given process.

Database Monitoring
You can monitor key performance indicators of a database in minutes. (Supports – MSSQL, Oracle, MySQL, MariaDB)

Multiple Platforms Support
Supports Windows, Linux operating systems and traditional servers, as well as other various platforms such as AWS, GCE and Azure.

Export Function
Monitoring metrics may be converted to various formats (image, document, spreadsheet).

Snapshot Function
Source of the problem can be easily found by providing a snapshot of each indicator at the time of the alert.
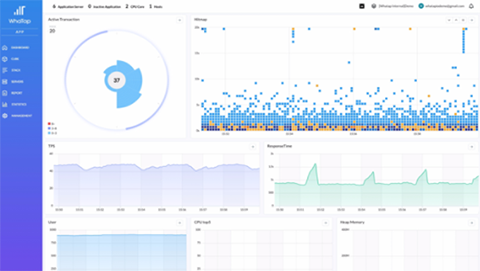
Node.js Application Monitoring enables detailed profiling of application transactions
If you have been checking only the resource usage of the Nod.js application, you can now monitor the transaction details as well.
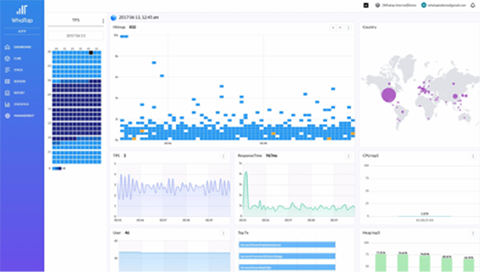
JAVA Application Monitoring lets you check even the code level of transactions
You can also monitor areas that were not previously available with Active Stack technology of WhaTap.
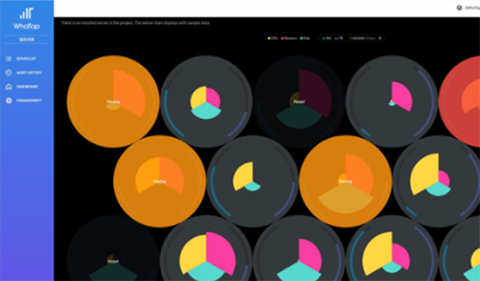
Infrastructure Monitoring shows servers in various environments at a glance
Not only physical servers, but also AWS, Azure, GCE, Aliyun, and other cloud servers can now be monitored in one area at the same time.
I am text block. Click edit button to change this text. Lorem ipsum dolor sit amet, consectetur adipiscing elit. Ut elit tellus, luctus nec ullamcorper mattis, pulvinar dapibus leo.